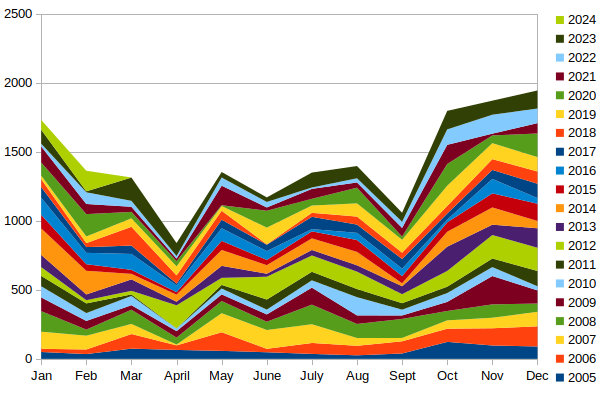
For as long as I can remember my father took daily weather records. Some of his enthusiasm has rubbed off and I have been taking rainfall readings since 1992. My equipment is simple. A graduated plastic funnel of the sort you can often buy in garden centres. It is just pushed into the soil away from overhanging plants. Readings are taken each day nominally at 08:00. I make no claim to any great degree of accuracy for individual readings but the cumulative results are accurate enough to expose long term trends. For this reason I have restricted the figures below to monthly totals.
My location is in the Stroud Valleys at about 250 feet. The surrounding hills are around 500-600 feet, no doubt the hill tops get more rainfall than the valleys.
| . | Jan | Feb | March | April | May | June | July | Aug | Sept | Oct | Nov | Dec | Totals |
| 1993 | 132 | 7 | 13 | 82 | 87 | 71 | 83 | 18 | 94 | 97 | 56 | 144 | 883 |
| 1994 | 103 | 86 | 48 | 57 | 80 | 24 | 15 | 37 | 118 | 67 | 77 | 118 | 830 |
| 1995 | 136 | 106 | 36 | 19 | 53 | 14 | 10 | 4 | 106 | 76 | 86 | 86 | 731 |
| 1996 | 56 | 64 | 63 | 49 | 36 | 25 | 41 | 87 | 29 | 60 | 108 | 33 | 651 |
| 1997 | 10 | 107 | 16 | 21 | 62 | 88 | 18 | 97 | 38 | 80 | 107 | 89 | 733 |
| 1998 | 119 | 12 | 91 | 91 | 10 | 112 | 18 | 42 | 115 | 130 | 70 | 94 | 905 |
| 1999 | 149 | 36 | 65 | 103 | 100 | 49 | 17 | 164 | 130 | 58 | 60 | 138 | 1069 |
| 2000 | 32 | 92 | 25 | 196 | 94 | 42 | 54 | 56 | 124 | 186 | 172 | 152 | 1226 |
| 2001 | 63 | 74 | 94 | 93 | 49 | 21 | 65 | 83 | 56 | 135 | 49 | 25 | 808 |
| 2002 | 107 | 148 | 41 | 53 | 118 | 63 | 85 | 28 | 32 | 166 | 140 | 116 | 1101 |
| 2003 | 77 | 24 | 44 | 59 | 70 | 48 | 120 | 13 | 13 | 60 | 101 | 95 | 726 |
| 2004 | 115 | 39 | 75 | 91 | 55 | 39 | 33 | 135 | 58 | 163 | 54 | 58 | 915 |
| 2005 | 50 | 35 | 74 | 65 | 58 | 48 | 36 | 26 | 39 | 123 | 97 | 90 | 741 |
| 2006 | 23 | 33 | 106 | 33 | 135 | 25 | 79 | 69 | 88 | 96 | 125 | 146 | 958 |
| 2007 | 124 | 100 | 73 | 6 | 138 | 136 | 136* | 56 | 24 | 60 | 76 | 105 | 1034 |
| 2008 | 149 | 44 | 103 | 50 | 88 | 60 | 142 | 102 | 138 | 68 | 97 | 60 | 1101 |
| 2009 | 99 | 63 | 33 | 47 | 48 | 53 | 123 | 62 | 25 | 66 | 205 | 95 | 919 |
| 2010 | 81 | 57 | 67 | 19 | 43 | 35 | 53 | 132 | 42 | 64 | 65 | 30 | 688 |
| 2011 | 75 | 70 | 11 | 1 | 26 | 73 | 62 | 59 | 47 | 46 | 62 | 111 | 643 |
| 2012 | 64 | 23 | 26 | 167 | 51 | 165 | 118 | 126 | 65 | 114 | 170 | 168 | 1257 |
| 2013 | 88 | 42 | 83 | 26 | 87 | 22 | 40 | 46 | 58 | 176 | 75 | 141 | 884 |
| 2014 | 192 | 171 | 40 | 51 | 115 | 62 | 84 | 97 | 21 | 108 | 125 | 53 | 1119 |
| 2015 | 98 | 45 | 29 | 18 | 66 | 38 | 51 | 86 | 52 | 68 | 102 | 125 | 781 |
| 2016 | 124 | 82 | 115 | 49 | 91 | 64 | 16 | 52 | 54 | 20 | 105 | 41 | 813 |
| 2017 | 78 | 42 | 61 | 13 | 62 | 46 | 89 | 60 | 70 | 44 | 65 | 104 | 734 |
| 2018 | 57 | 29 | 136 | 60 | 65 | 3 | 29 | 58 | 46 | 55 | 78 | 89.5 | 705 |
| 2019 | 26 | 48 | 61 | 65 | 34 | 121 | 53 | 95 | 93 | 147 | 116 | 104 | 963 |
| 2020 | 95 | 162 | 47 | 38 | 6 | 122 | 49 | 114 | 23 | 157 | 56 | 171 | 1040 |
| 2021 | 116 | 73 | 37 | 18 | 142 | 24 | 72 | 38 | 63 | 139 | 13 | 75 | 810 |
| 2022 | 20 | 85 | 43 | 19 | 59 | 40 | 10 | 30 | 45 | 112 | 137 | 106 | 706 |
| 2023 | 101 | 7 | 169 | 94 | 40 | 33 | 108 | 89 | 65 | 134 | 102 | 131 | 1073 |
| 2024 | 71 | 149 | 148 | 61 | 102 | 27 | 93 | 40 | 209 | 101 | 111 | 56 | 1168 |
| 2025 | 120 | 59 |
* true total higher, rain gauge overflowed!
Copyright © Bill Phillips 2025